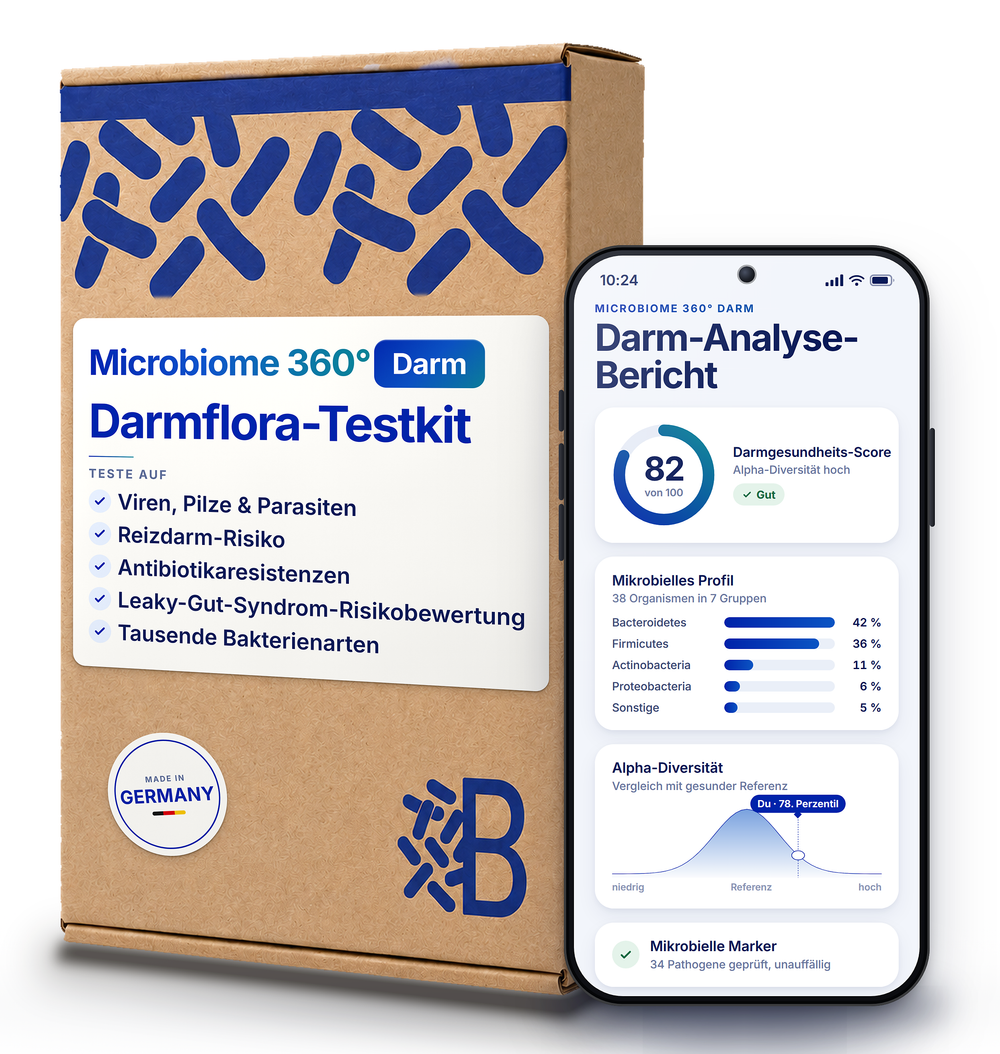
€229,00Tax included. Shipping calculated at checkout.
In stock, ships immediatelyWith you in 1 to 3 working days
Beyond a simple gut test. Your entire gut microbiome decoded & analyzed.
With Microbiome 360° Gut, Bactera offers one of the most advanced gut microbiome analyses available. Conventional tests read only single genes. We decode the entire DNA of your stool sample using shotgun sequencing and identify bacteria, viruses, fungi and parasites down to species level.
Your sample is analyzed in-house in Germany, using advanced bioinformatics and the highest scientific standards. The result is a comprehensive view of your microbiome: microbial diversity, gut health, metabolism and other key areas of your health.
One test. 360° analysis. Complete DNA. Deeper insights.
Your gut at a glance
Gut health rating, bacterial diversity and microbiome age
Risk patterns for conditions – from IBS, leaky gut and colorectal cancer to type 2 diabetes, depression and more
Gut function scores: fibre fermentation, mucus layer, gas production, inflammatory pressure, sleep support
Resilience index: how well your gut flora recovers from disruptions such as antibiotics
Your gut type (enterotype) and your 5 key bacteria (BIG5)
What lives in your gut
Deep shotgun DNA sequencing: thousands of organism species analysed, not just broad bacterial families
The key organisms of your gut flora, grouped by function and each compared with thousands of healthy reference samples
The key organisms of your gut flora, grouped by function and each compared with thousands of healthy reference samples
Testing for pathogens, parasites, viruses, yeasts and fungi
Antibiotic resistance genes, sorted by drug class
Included
Your personal action plan with clear explanations and recommendations
Full species list and raw data to download, free report upgrades as new analyses become available
Free personal support by e-mail: our Bactera expert team answers your questions and gives recommendations on your results
Scientific methodology at the highest level
Analysis in Germany with our own bioinformatics pipelines
Enter your email address and your gift is waiting in the checkout. No code to type, no detour.
Microbiome 360°Gut€229,00€219,00incl. VAT and free shipping within Germany
By submitting you will receive our emails on gut health and offers, unsubscribe at any time. The code Bactera10 is applied automatically in the checkout.
Includes our newsletter, unsubscribe any time. Code Bactera10 applies automatically at checkout.
Answers, not guesses
Who this test is for
For people who want to know what is really going on in their gut
Gut symptoms without a clear cause, constant tiredness, the weeks after antibiotics or simply the wish to age well: Microbiome 360° Gut shows you which bacteria, viruses, fungi and parasites live in your gut and what that means for you. From one stool sample, collected at home, analysed in Cologne.
Sound familiar?Does your gut run your day?
Gut symptoms, but no answers
Bloating, diarrhoea, constipation or suspected IBS, and your doctor says everything looks normal. Your report shows how your diversity, core bacteria and 34 clinically relevant organisms are doing.
DiarrhoeaBloatingIBS
Sound familiar?Tired despite a healthy lifestyle?
Energy, sleep and immune system
Exhaustion, frequent infections or cravings can be linked to your gut. You see whether your microbiome can produce key compounds such as butyrate and how stable it is.
FatigueCravingsFrequent infections
Sound familiar?After antibiotics or an infection?
Know how your gut has recovered
After antibiotics, a stomach infection or a change of diet. The report shows which species are missing, which dominate and whether resistance genes are detectable.
AntibioticsStomach infectionDiet change
Sound familiar?Ageing well?
Prevention based on data, not gut feeling
You look after your diet, exercise and sleep and want to know whether your gut keeps up. With microbiome age, gut health score and a risk assessment for 15 conditions.
Microbiome ageMetabolismPrevention
Self-checkWhat applies to you? Tap to select.
SymptomsSuspected or diagnosedYour situation
Your resultDo you recognise yourself?
Then the answer is in the DNA of your stool sample. We read it completely: bacteria, viruses, fungi and parasites in one run, down to species level. Most other gut tests only capture bacteria. You will learn more in the next sections.
Order test kit€229 incl. VAT. With you in 1 to 3 working days.
Maximum data securityMade in GermanyScience-based★★★★★4.96 (25 reviews)
Do you recognise yourself?
Then the answer is in the DNA of your stool sample. We read it completely: bacteria, viruses, fungi and parasites in one run. Most other gut tests only capture bacteria. You will learn more in the next sections.
Order test kit€229 incl. VAT. With you in 1 to 3 working days.
Maximum data securityMade in GermanyScience-based★★★★★4.96 (25 reviews)
What you get
Everything that lives in your gut. And what it means for you.
One of the deepest and most comprehensive gut flora analyses you can get. We read the entire DNA of your stool sample and explain every result to you.
Bacteria
Viruses
Fungi
Parasites
10 millionDNA fragments are what we read from your stool sample. A typical gut test reads about 10,000, only a tiny excerpt*. That is why we detect not only bacteria but also viruses, fungi and parasites, down to the exact species.
Order test kit€229 incl. VAT. With you in 1 to 3 working days.
my.bactera.de/demoSample
OverviewHow your gut worksHealth indexMicrobial profileScreeningResistance genes
10:24Sample
Microbiome 360° Gut · Sample ABCD1234Your gut at a glance
82of 100
Gut health scoreDiversity, core bacteria and function in one number. Within the range of the healthy reference group.Normal
DiversityMore species than 78 of 100 healthy people
You
Microbiome age39 yearsYou are 45. Your gut appears biologically younger.
Identified species2,136Bacteria, viruses, fungi and parasites, each named in your list
Who lives in your gutMicrobial profileCompared with healthy people. One entry open:
Faecalibacterium prausnitziiLow
P22Percentile: more than in 22 of 100 healthy people. Relative abundance 1.9 %
LessHealthy medianMore
What this means: This species produces butyrate, the most important fuel of your gut cells, and curbs inflammation. In you it is rarer than in most people.
Recommendation: More fibre from oats, legumes and vegetables.
Akkermansia muciniphilaP91Very high
Bifidobacterium spp.P54Normal
Ruminococcus gnavusP88Elevated
Roseburia spp.P71High
+ 34 more organisms, plus thousands of species in your list+ 34 more organisms
Your five core bacteriaBIG5Five groups of bacteria that keep your gut stable. One open:
Agathobacter rectalisVery low
P6Percentile: less than in 94 of 100 healthy people
LessHealthy medianMore
What this means: An important butyrate producer is almost missing. Your gut gets less energy for its lining and reacts less stably to disturbances.
Recommendation: Resistant starch from cooled potatoes or rice, whole grains and legumes.
Faecalibacterium prausnitziiP22Low
Roseburia spp.P71High
Bifidobacterium spp.P54Normal
Akkermansia muciniphilaP91Very high
What your gut can doFunctional panelsCalculated from your bacteria. One panel open:
What this means: Fewer protective butyrate producers, more bacteria that irritate the gut wall. Typical for people affected.
Recommendation: Concrete steps in the report, to take along to your doctor.
Gout47 %Risk
Irritable bowel syndrome10 %Neutral
Small intestinal bacterial overgrowth (SIBO)67 %Protective
Type 2 diabetes72 %Protective
+ 10 more, for example colorectal cancer, fatty liver, obesity+ 10 more conditions
Safety checkPathogens34 clinically relevant organisms checked. One entry open:
Blastocystis hominisDetected
Parasite, lives in the large intestine. Detected via its DNA, relative abundance 0.4 %.
Not detectedDetected
What this means: A common gut parasite. In many people without symptoms, in some linked to bloating and diarrhoea.
Recommendation: If you have symptoms, discuss it with your doctor.
Helicobacter pyloriBacteriumNot detected
Candida albicansYeastNot detected
Giardia lambliaParasiteNot detected
+ 30 more bacteria, yeasts, viruses and parasites+ 30 more pathogens
ResistomeAntibiotic resistance genesHundreds of genes checked, sorted by drug class. One open:
TetracyclinesDetected
4resistance genes against this antibiotic class found in your sample
Genes found (4)tet(W)tet(Q)tet(O)tet(32)
What this means: Some of your gut bacteria are insensitive to tetracyclines. Often a consequence of earlier antibiotics.
Recommendation: Helpful for your doctor when choosing an antibiotic.
Macrolides2Detected
Beta-lactams0Not detected
Quinolones0Not detected
Glycopeptides0Not detected
+ 9 more drug classes+ 9 more classes
Gut health score, diversity and microbiome age. For example: is your gut biologically younger or older than you?
Bacteria, viruses, fungi and parasites. For the most important organisms you see whether you have more or less of them than healthy people. Plus thousands more species in your list.
From the bacteria living in you we calculate how well your gut does its jobs: does it make enough butyrate, the most important fuel of your gut cells? How much gas is produced? How stable is the protective layer of your gut wall? Five areas, each as a traffic light.
Does your gut flora resemble the pattern often found in people affected? For example IBS, leaky gut syndrome or type 2 diabetes. Each one explained.
Bacteria, yeasts, viruses and parasites that can cause symptoms, for example Helicobacter, Candida or Giardia. Plus hundreds of antibiotic resistance genes.
Concrete steps for every abnormal value, written in plain language. Your report stays in your account and gets free updates whenever new analyses are added.
*Comparison of analysis methods (shotgun sequencing versus 16S), not of individual providers.
Why Bactera
Among the leading gut microbiome analysis providers in Europe.
Most gut tests only scratch the surface. With DNA shotgun sequencing we reveal the full picture of your gut microbiome and turn complex biology into clear, usable insights. Every analysis follows the highest scientific standards, and we keep investing in the most advanced technology and our own analytic tools.
Made in Germany
Analysis and evaluation are done by us in Cologne, within the German and European regulatory framework.
Sequenced to ISO standards
The DNA of your sample is read in Cologne to ISO standards. Scientific methodology at the highest level, with the method used in microbiome research.
The most advanced technology
Shotgun metagenomics with 10 million paired-end reads per sample, 25 million on request, current sequencing chemistry and the latest analytic tools.
Highest scientific standards
Validated, standardised methods from sample collection to report. Our bioinformatics pipelines and reference cohorts are built, reviewed and continuously improved by our own team.
Pseudonymised and GDPR compliant
We analyse samples pseudonymously and store your data securely under the GDPR.
CologneHeadquarters, Germany
4 disciplinesMicrobiology, human medicine, bioinformatics, computer science
Everything happens at home and by post. Nothing to buy, nothing to pack and no appointment needed.
1
Order and register
Your kit is with you in 1 to 3 working days. Register it online with the code from the box.
2
Collect your sample at home
A few minutes with the tube from the kit, illustrated step by step.
3
Send it back prepaid
The same box goes back with the prepaid label. The solution in the tube keeps the sample stable, no cooling needed.
4
Read your report
After 4 to 6 weeks your report is in your account, with explanations and recommendations.
Everything is in the kit
Collection tube with stabilising solution, collection aid, illustrated instructions, sample ID card, hygiene bag and the prepaid return label. Nothing to buy and no appointment to make.
What comes next
The next sections show you in detail what our analysis delivers and what your report can tell you about the health of your gut microbiome.
Just keep reading at your own pace. Each section shows you examples from the report, exactly as you will see it later in your portal.
All from one stool sample, collected at home, analysed in Cologne.
01The differenceWhy we read the entire DNA of your sample
02Your reportWhat you get: values, explanations and an action plan
03What is testedTwelve analysis areas from a single sample
04Risk assessment15 conditions, classified based on your microbiome
05The methodShotgun metagenomics instead of a 16S test
The difference
The complete microbiome picture from a single stool sample
Most microbiome tests in Germany use 16S sequencing or culture methods, and both mainly capture bacteria. We read the entire DNA of your stool sample, so viruses, fungi and parasites are picked up in the same analysis.
BacteriaDown to species level
Thousands of bacterial species identified from the DNA in your sample, with the main phyla and genera, species count and evenness, compared with a healthy reference cohort.
VirusesDNA viruses in stool
Selected clinically relevant DNA viruses are captured in the same sequencing run, with no extra sample.
FungiYeasts and moulds
From beneficial yeasts such as Saccharomyces boulardii to Candida species and moulds.
ParasitesProtozoa and worms
Giardia, Entamoeba, Blastocystis, Cryptosporidium and more, as a pure detection screening from the same stool sample.
Your report
What you get: a report that explains instead of just measuring
For every value you see the reference range, what it means for you and what to do next. Use the report interactively in the portal or download it.
Interactive in the portalDesktop and mobile, available at any time at my.bactera.de. You can also download the report and share it, for example with your doctor.
Highest scientific standardVery deep analysis with 10 million paired-end reads per sample. On request we go further: 25 million reads, virulence gene analysis and phage analysis, all from the same sample. See the options.
Raw data includedFASTQ files and abundance tables to download
At a glanceSample illustration
Species identified2527
Your microbiome diversityAverage
Microbiome age44 yrs
Gut Health Score94/100
Gut Health Score
94
EXCELLENT
Resilience & Stability Index
74
GOOD
BIG5 core bacteria
F. prausnitziiNormal
Roseburia spp.Normal
A. rectalisLow
Bifidobacterium spp.High
A. muciniphilaNormal
Microbial screening
!Clinically relevant bacterial, viral or parasitic DNA detected in your sample.
Twelve analysis areas from a single stool sample, all in one report.
12Analysis areas: alpha diversity, microbiome age and more
34Clinically relevant microorganisms screened
Complete
pictureBacteria, viruses, fungi and parasites at species level
100sAntimicrobial resistance genes
4Enterotypes: protein, plant-based, complex carbohydrate, fats and more.
20Risk assessment & functional potential
FreeReport upgrades as new analyses become available
01 / 12
Alpha Diversity Index
Measures how many different microorganisms live in your gut and how balanced they are. Higher diversity is associated with better digestion, immunity and metabolic health.
Sample illustration from the report
% healthy referenceAlpha Diversity Index
Your Index (4.18) is in the 62nd percentile, meaning it scores higher than 62% of the healthy reference samples.
Your gut microbiome shows a moderate and balanced diversity. This points to an ecosystem within the healthy range.
02 / 12
Microbiome Age
Your gut can be “older” or “younger” than your chronological age. We compare your microbiome with thousands of healthy profiles to estimate its biological ageing.
Sample illustration from the report
44yrs
Result < −10Younger than your chronological age
−10 to +10Age-appropriate
Result > +10Older than your chronological age
The biological microbiome age is calibrated against healthy reference data and expressed as the difference from your chronological age.
03 / 12
Gut Health Score & Microbiome Resilience Index
Two easy-to-understand indices: the Gut Health Score summarises inflammatory potential, protective bacteria and metabolic activity; the Resilience & Stability Index estimates how well your gut ecosystem can recover after disruptions such as antibiotics, infections or stress.
Sample illustration from the report
94
EXCELLENTGut Health Score
74
GOODResilience & Stability Index
A score in this range reflects a highly balanced gut ecosystem with strong microbial diversity and few risk-associated patterns; the index shows a stable, adaptable microbiome that is well equipped to recover after disruptions.
Summarises
Inflammatory potentialProtective bacteriaMetabolic activityRecovery after antibiotics, infections and stress
04 / 12
Microbiome-associated risk assessment
For 15 conditions across four areas, from IBS and IBD to colorectal cancer and type 2 diabetes, we calculate a protection or risk value from your microbiome and show which bacterial strains are involved.
Sample illustration from the report
Colorectal cancer37 % Risk
Inflammatory bowel disease (IBD)58 % Protective
Irritable bowel syndrome (IBS)47 % Risk
Type 2 diabetes27 % Neutral
Leaky gut syndrome22 % Neutral
Each value is read from the centre: to the right towards risk, to the left towards protection. Five of the 15 assessments are shown.
Five panels show what your bacteria can actually do: gas production, sleep and circadian rhythm support, butyrate support, inflammation pressure and mucin degradation, each placed on a traffic-light scale against the healthy reference population, with the organisms that shape your score.
Sample illustration from the report
Gas productionP87 Elevated
Sleep & circadian rhythm supportP99 Favourable
Butyrate supportP59 Favourable
Inflammation pressureP10 Favourable
Mucin degradationP17 Favourable
P87 means higher than 87 of 100 healthy people. Green zones are favourable, amber and red call for attention.
Each panel shows
Percentile against the healthy referenceOrganisms driving the scoreWhat it means for you
Evaluates whether the most important beneficial bacteria, which support digestion, immunity and protection against pathogens, are present in sufficient amounts in your gut.
Sample illustration from the report
Faecalibacterium prausnitziiNormal
Roseburia spp.Normal
Agathobacter rectalisLow
Bifidobacterium spp.High
Akkermansia muciniphilaNormal
Suggests healthy butyrate production and balanced immune regulation within the gut.
The 38 microorganisms with the most reliable human evidence, from butyrate producers to mucus degraders, bifidobacteria, sulfur metabolisers, opportunists and gut yeasts. For each one you see its relative abundance, its percentile against our healthy reference cohort and a plain-language interpretation of what that level means for that particular organism.
Sample illustration from the report
Faecalibacterium prausnitziiP58 · Normal
Anaerobutyricum halliiP91 · Very High
BifidobacteriumP4 · Very Low
Mediterraneibacter torquesP86 · Elevated
Methanobrevibacter smithiiP93 · Very High
Seven groups: fiber fermenters · mucus layer & barrier · lactic-acid bacteria · protein, bile acid & sulfur · diet pattern & gas · opportunists · gut yeasts.
Your gut microbiome reflects your long-term eating habits. Certain groups of bacteria become more dominant depending on the foods you eat regularly. On this basis, your microbiome can be assigned to four general dietary patterns. Most people show a combination of these patterns, with one usually more pronounced than the others.
Sample illustration from the report
Plant-Based Foods48%
Well-Balanced26%
Complex Carbohydrates17%
Proteins & Fats9%
Plant-Based Foods, 48%. This pattern reflects a microbiome adapted to breaking down plant-based foods, especially fiber-rich carbohydrates.
09 / 12
Screening of microbial markers
We analyse your microbiome data for the DNA of 29 clinically relevant microorganisms: bacteria, parasites and DNA viruses. These have been linked to gastrointestinal symptoms such as abdominal pain, diarrhoea, bloating, fatigue or imbalance after antibiotic therapy. Many of these microbial signals often go unnoticed, because the symptoms frequently resemble those of common complaints such as irritable bowel syndrome or food intolerances.
Sample illustration from the report
!2 clinically relevant markers detected. The DNA of Adenovirus and Salmonella enterica was found in your sample. The report explains what the detection means and which follow-up is advisable.
Your gut is home to more than bacteria: yeasts and fungi are part of the ecosystem too. When their balance is disturbed, they can contribute to persistent bloating, sugar cravings, histamine reactions, skin problems or symptoms that get worse after antibiotics. We screen for clinically relevant fungi to distinguish normal colonisation from problematic overgrowth.
Sample illustration from the report
Saccharomyces cerevisiae
BeneficialFood Associated
PresenceCommon in bread, beer, and fermented foods.
InterpretationGenerally harmless and may support gut balance. No action required unless symptoms are present.
Some gut bacteria can carry resistance to common antibiotics, which may explain why earlier treatments did not work as expected. We screen your sample against hundreds of known antimicrobial resistance genes and assign each detected gene to its drug class; the examples below show which commonly prescribed antibiotics this covers. This information helps in choosing the most effective therapy, avoids unnecessary medication and is particularly valuable before surgery, immunosuppressive treatment or in the case of recurring infections.
Sample illustration from the report
!4 resistance genes detected
Drug class
Gene
Status
Macrolides
erm(B)
Detected
Tetracyclines
tet(O)
Detected
Tetracyclines
tet(W)
Detected
Tetracyclines
tet(M)
Detected
Resistance genes make certain bacteria less susceptible to individual antibiotic classes. The report shows drug class, gene and status.
Full list of your microorganisms & free report upgrades
You receive the complete list of every microorganism identified in your sample, together with the raw data. And your report does not stand still: we continuously add new analyses, markers and insights, and whenever a new analysis becomes available your existing sequencing data is re-analysed and your report upgraded, free of charge and without a new stool sample.
Included
Full organism listFASTQ files and abundance tablesFree report upgradesNo new sample needed
Microbiome-associated risk assessment
Leaky Gut Syndrome, IBD, colorectal cancer, type 2 diabetes and eleven more risk assessments
For 15 conditions across four areas, we calculate a protection or risk value from your microbiome. Each assessment shows you which bacterial strains are involved and explains what the result means.
Digestive Disorders
8 assessments
Colorectal Cancer
Inflammatory Bowel Disease (IBD)
Irritable Bowel Syndrome (IBS)
Leaky Gut Syndrome
Non-Coeliac Gluten Sensitivity
Obesity
Small Intestinal Bacterial Overgrowth (SIBO)
Type 2 Diabetes
Metabolic & Hormonal
4 assessments
Gout
Hyperlipidemia & Cholesterol Metabolism
Non-Alcoholic Fatty Liver Disease (NAFLD)
Polycystic Ovary Syndrome (PCOS, women only)
Neurological & Mental Health
2 assessments
Chronic Fatigue Syndrome (ME/CFS)
Depression & Anxiety
Autoimmune
1 assessment
Autoimmune Conditions (atopic eczema, asthma)
How it appears in the report
Each assessment shows a protection or risk value with a bar, the contributing bacterial strains as chips and a one-sentence interpretation. Values up to 35 are neutral and shown in blue. Above 35, green stands for a protective profile and red for an increased risk.
Risk associated taxa are somewhat more prominent than protective ones, with reduced levels of butyrate producing bacteria and increased microorganisms linked to inflammation.
Risk associated features outweigh protective ones, including reduced fibre fermenting bacteria and increased microorganisms associated with altered motility and gut sensitivity.
The microbial composition is relatively neutral, with a mixture of protective and risk associated features without a clear predominance of either profile.
Noticeable dysbiosis is present, including reduced levels of bacteria that support epithelial barrier integrity and increased microorganisms associated with low-grade inflammation. This pattern may be linked to increased intestinal sensitivity after gluten ingestion.
The microbial composition is relatively neutral, with a mixture of protective and less favorable taxa. Certain microbial features may modestly influence metabolic regulation.
Small Intestinal Bacterial Overgrowth (SIBO)7% Neutral
Contributing bacterial strains
Desulfovibrio pigerEnterococcus faecalisEnterococcus faeciumMethanobrevibacter smithiiBacteroidesBifidobacteriumButyrivibrioCoprococcusLactobacillusStreptococcus+ 4 more
The microbial composition is relatively neutral, with a mixture of protective and risk associated features and no clear predominance of either pattern.
The microbial composition is relatively neutral, with a mixture of protective and less favorable taxa. Certain microbial features may modestly influence glucose regulation.
Functional Potential
What your microbiome can do: five functional panels
Here the question shifts from which bacteria live in your gut to what they can actually do. Each panel shows on a traffic-light scale where you stand against the healthy reference population, with a short interpretation and the organisms that shape your score.
Your five panels at a glanceSample illustration from the report
Gas Production
LOWP87HIGH
!
Reflects the activity of microbial fermentation processes that produce gases such as methane and hydrogen sulfide. These influence gut motility, sensitivity and digestive comfort.
Your microbiome shows increased gas-producing activity compared with the healthy reference population. This indicates more active microbial fermentation and may be associated with a greater tendency toward gas formation, depending on diet and individual sensitivity.
What is driving this score
Contributors increasing pressure
M. smithiielevated
D. pigerelevated
7 absent contributors
Sleep & Circadian Rhythm Support
LOWP99HIGH
✓
Shows how closely your microbiome resembles microbial patterns linked to healthy sleep quality and a stable sleep-wake rhythm, for example via short-chain fatty acids, tryptophan metabolites and GABA.
Your microbiome shows a favorable representation of microbial features associated with healthy sleep quality and circadian alignment.
What is driving this score
Positive contributors
C. eutactushigh
F. prausnitziiaverage
B. fragilisnot detected
Negative contributors
C. leptumnot detected
Oscillibacternot detected
Butyrate Support
LOWP59HIGH
✓
Shows how well equipped your microbiome is to produce butyrate: the most important energy source for gut cells, central to the barrier, immune regulation and inflammation balance.
Your microbiome shows a typical representation of bacteria associated with butyrate production. This suggests a balanced capacity for fermentation of dietary fiber.
What is driving this score
Positive contributors
R. intestinalishigh
A. halliihigh
F. prausnitziiaverage
Missing contributors
A. rectalisnot detected
R. hominisnot detected
R. bromiinot detected
Inflammation Pressure
LOWP10HIGH
✓
Reflects microbial features linked to activation of the immune system, in particular gram-negative bacteria carrying lipopolysaccharides (LPS).
Your microbiome shows lower levels of inflammation-associated microbial signals compared with the healthy reference population. This points to a favorable microbial environment.
What is driving this score
Contributors increasing pressure
D. pigerelevated
18 absent contributors
Mucin Degradation
LOWP17HIGH
✓
Shows the share of bacteria that can use components of the mucus layer as a nutrient source. Controlled mucin turnover is normal, excessive activity can put strain on the gut barrier.
Your microbiome shows relatively low representation of bacteria associated with mucin utilisation, suggesting limited microbial reliance on the intestinal mucus layer.
What is driving this score
Contributors increasing pressure
M. torquesaverage
5 absent contributors
Favorable range
Notable
Elevated
P = percentile versus the healthy reference
Your microbial profile
38 organisms in 7 groups, each compared with a healthy cohort
Shotgun sequencing resolves microorganisms down to species level, not just genus or family. The report profiles the 38 organisms with the strongest human evidence: how abundant each one is in your sample, how that compares with healthy people, and what the value means for the group it belongs to.
Your profile at a glanceSample illustration from the report
Each row is one group and each marker one organism, placed at its percentile and coloured by the band it falls into. Markers past the divider are detection-only organisms. Tap a marker to name it.
Fiber-Fermenting Core Species
Mucus Layer & Barrier Interface
Lactic-Acid & Early-Life Bacteria
Protein, Bile Acid & Sulfur Metabolism
Diet-Pattern & Gas-Forming Organisms
Opportunistic Organisms & Pathobionts
Gut Yeasts
010257590100
average (beneficial)average (context)outside typicalmarkedly outsidedetectednot detected
Fiber-Fermenting Core Species
↗ Butyrate Support
The engine room of a healthy colon: they break down the dietary fiber your own enzymes cannot digest and convert it into short-chain fatty acids, above all butyrate, the preferred fuel of the cells lining your large intestine.
Faecalibacterium prausnitziiCore 5
One of the most abundant bacteria in the healthy colon; ferments fiber into butyrate and releases anti-inflammatory molecules.
LOW
P58Normal
HIGH
4.82%median 3.94%
Agathobacter rectalisCore 5
A major butyrate producer whose abundance tracks fiber intake closely enough to be informative.
LOW
P82High
HIGH
3.16%median 1.72%
Roseburia intestinalis
Ferments plant cell-wall material such as xylan and β-glucan from oats and rye.
LOW
P46Normal
HIGH
0.91%median 0.98%
Roseburia hominis
A butyrate producer consistently reduced in ulcerative colitis; absent in roughly a quarter of healthy adults.
LOW
n/aNot detected
HIGH
also absent in 26% of healthy references
0.00%median 0.21%
Anaerobutyricum hallii
A cross-feeder that converts lactate and acetate into butyrate and prevents lactate build-up.
LOW
P91Very High
HIGH
1.24%median 0.34%
Anaerostipes hadrus
Another lactate-to-butyrate converter, found in the great majority of healthy adults.
LOW
P63Normal
HIGH
0.77%median 0.58%
Ruminococcus bromii
A keystone species: one of very few gut bacteria able to make the first cut into resistant starch.
LOW
P54Normal
HIGH
0.62%median 0.55%
Coprococcusgenus
Butyrate and propionate producers repeatedly linked in large population studies to quality of life and mood.
LOW
P21Low
HIGH
0.18%median 0.44%
Mucus Layer & Barrier Interface
↗ Mucin Degradation
A small, specialised group lives in and on the mucus layer that separates bacteria from your own cells. Controlled turnover is normal; the question is one of balance, particularly when fiber is scarce.
Akkermansia muciniphilaCore 5Context
Lives in the mucus layer and stimulates the gut lining to renew itself. Both very low and very high are worth noting.
LOW
P71Normal
HIGH
1.86%median 0.72%
Bacteroides thetaiotaomicronContext
A metabolic generalist that switches to mucus sugars when dietary fiber runs short, making it a sensitive read-out of fiber supply.
LOW
P44Normal
HIGH
0.95%median 1.11%
Mediterraneibacter torques
A specialised mucin degrader; elevated levels point specifically at increased mucus turnover. Enriched in inflammatory bowel conditions.
LOW
P86Elevated
HIGH
0.51%median 0.13%
Ruminococcus gnavus
One of the most reproducible microbial signals in IBD. Present at low levels in most healthy people; it is expansion that matters.
LOW
P34Normal
HIGH
0.22%median 0.31%
Odoribacter splanchnicus
Produces butyrate, propionate and sulfonolipids that appear to calm intestinal immune signalling.
LOW
P59Normal
HIGH
0.31%median 0.26%
Lactic-Acid & Early-Life Bacteria
↗ Core 5
The bifidobacteria and lactobacilli of infant guts, fermented foods and probiotic capsules. They acidify the colon and make it harder for unwanted organisms to establish. In adults a modest but meaningful part of the community that responds quickly to diet.
BifidobacteriumgenusCore 5
The combined level of all bifidobacteria; the figure your Core 5 result and most published studies refer to.
LOW
P4Very Low
HIGH
0.03%median 1.64%
Bifidobacterium adolescentis
The dominant adult bifidobacterium and the species that actually persists past childhood.
LOW
P6Very Low
HIGH
0.02%median 0.81%
Bifidobacterium infantis
One of the most widely supplied probiotic species and a producer of indole-3-lactic acid.
LOW
P11Low
HIGH
0.01%median 0.42%
Bifidobacterium bifidum
Breaks down sugars outside the cell and shares them with neighbours; absent in many healthy adults.
LOW
n/aNot detected
HIGH
also absent in 65% of healthy references
0.00%median 0.06%
Lactobacillaceaefamily
The lactobacilli of yoghurt, ferments and probiotic capsules. Detection usually reflects recent intake rather than a stable resident population.
Not detecteddetected in 71% of healthy references
n/amedian n/a
StreptococcusgenusContext
Mostly oral and dairy streptococci. A raised stool level is one of the more informative signals of an upper-gut pattern, but equally often a yoghurt habit.
LOW
P88High
HIGH
1.42%median 0.29%
Protein, Bile Acid & Sulfur Metabolism
↗ Gas Production
Protein, fat and bile acids feed a second set of bacteria whose by-products, ammonia, hydrogen sulfide and secondary bile acids, are useful in small amounts but irritating in excess. The counterweight to the fiber fermenters.
Bilophila wadsworthia
Converts taurine from bile into hydrogen sulfide; one of the fastest responders to a high-fat, high-animal-protein diet.
LOW
P39Normal
HIGH
0.14%median 0.16%
Desulfovibrio piger
The most common sulfate-reducing bacterium in the gut; sulfide competes with butyrate for use by your gut cells when abundant.
LOW
P77Elevated
HIGH
0.09%median 0.04%
Alistipes putredinisContext
Ferments protein but also produces propionate; the evidence points in both directions.
LOW
P52Normal
HIGH
1.03%median 0.97%
Bacteroides fragilisContext
Its surface molecule PSA trains regulatory immune cells, yet a minority of strains carry a toxin gene. Strain-level typing is not part of the report.
LOW
P28Normal
HIGH
0.19%median 0.35%
Eggerthella lenta
Transforms bile acids, plant polyphenols and certain medicines; the bacterium known to inactivate digoxin.
LOW
P41Normal
HIGH
0.05%median 0.06%
Diet-Pattern & Gas-Forming Organisms
↗ Enterotype
Some organisms say more about how you eat and how your gut moves than about whether you are healthy. Shown in blue: context, not verdict.
Bacteroides + PhocaeicolagenusContext
The largest bacterial group in most Western guts; the total that defines your enterotype.
LOW
P62Normal
HIGH
21.4%median 18.6%
Bacteroides uniformisContext
A dependable degrader of dietary plant fiber and a main workhorse converting plant material into propionate.
LOW
P66Normal
HIGH
3.28%median 2.71%
Segatella copriContext
Formerly Prevotella copri: the signature organism of high-fiber, plant-heavy diets and the counterpart to the Bacteroides pattern.
LOW
n/aNot detected
HIGH
also absent in 62% of healthy references
0.00%median n/a
Methanobrevibacter smithiiContext
An archaeon that converts hydrogen to methane, which slows intestinal transit. Associated with firmer stools and bloating, and with leaner body composition.
LOW
P93Very High
HIGH
0.87%median 0.05%
Christensenella minuta
The most strongly heritable organism in the human gut, consistently more common in lean individuals.
Detecteddetected in 34% of healthy references
0.02%median n/a
Opportunistic Organisms & Pathobionts
↗ Inflammation Pressure
Harmless residents in small numbers that can take advantage of a disturbed environment. Finding them is normal and not a sign of infection; what matters is proportion, which is why low values are shown in green.
Escherichia coliContext
A normal minority resident that keeps the colon anaerobic; the result reflects total E. coli, not any disease-causing type.
LOW
P67Normal
HIGH
0.44%median 0.21%
Klebsiella pneumoniae
Can expand markedly after antibiotics and frequently carries resistance genes, which makes low levels reassuring.
LOW
P5Very Low
HIGH
<0.01%median <0.01%
Enterococcus faecalis
One of the first species to bloom after an antibiotic course; a useful marker of ecosystem recovery.
LOW
P58Normal
HIGH
0.02%median 0.01%
Fusobacterium nucleatum
Primarily a mouth bacterium that reaches the gut by swallowing. Detection on its own is a common finding in healthy people.
Not detecteddetected in 18% of healthy references
n/amedian n/a
Flavonifractor plautii
Degrades dietary flavonoids before your body can absorb them; repeatedly elevated in inflammatory and metabolic conditions.
LOW
P74Normal
HIGH
0.11%median 0.07%
Enterocloster bolteae
Expands specifically when the fiber-fermenting community thins out; an indicator of ecosystem balance.
LOW
P49Normal
HIGH
0.06%median 0.06%
Gut Yeasts
↗ Fungi
Fungi make up a tiny fraction of the gut community but are frequently asked about. Because fungal levels swing with what you eat, no reliable healthy range exists, so they are reported as presence only.
Saccharomyces cerevisiae
Baker's and brewer's yeast; detection almost always reflects diet rather than colonisation.
Detecteddetected in 48% of healthy references
0.01%median n/a
Candida albicans
A normal member of the gut community in a substantial minority of healthy adults. Finding it in stool is not “candida overgrowth”.
Not detecteddetected in 22% of healthy references
n/amedian n/a
Nakaseomyces glabratus
Formerly Candida glabrata; naturally less responsive to standard antifungal drugs, which is why it is named separately.
Not detecteddetected in 9% of healthy references
n/amedian n/a
BeneficialHigher levels are generally more favourable. Low may be less favourable; very high simply means well represented.
Depends on contextNeither high nor low is automatically good or bad. Read together with diet, symptoms and the rest of the profile.
Concern at higher levelsNormal residents that can become problematic when they expand. Low is unremarkable, never alarming.
Detection onlyToo rare or transient for a percentile to mean anything, so we report presence and how common that is in healthy people.
BIG5 core bacteria
BIG5: five core bacteria at a glance
These five bacterial groups show at a glance how well your gut bacteria produce butyrate and ferment fibre, how they feed each other (cross-feeding), how they interact with the immune system and how the mucus layer is doing. In the report, each group gets the status Low, Normal or High with a short interpretation. All five are also part of the 38-organism profile above.
Faecalibacterium prausnitziiNormalMost important butyrate producer of the core community.
Roseburia spp.NormalFibre fermentation and butyrate via cross-feeding.
Agathobacter rectalisLowFormerly Eubacterium rectale, central to starch breakdown.
Bifidobacterium spp.HighLactic acid, lactate production and early colonisation ecology.
Akkermansia muciniphilaNormalMucus layer and interface with the gut barrier.
In detail
What we screen in addition to your gut flora
We also check your sample for 34 clinically relevant DNA markers of bacteria, parasites and DNA viruses, for yeasts and fungi in a dedicated panel, and for hundreds of antimicrobial resistance genes sorted by drug class. All from the same sequencing.
Many of these fungi enter the gut via food or the environment and are detectable there temporarily.
The gut is one of the body's largest reservoirs of bacteria. Some microorganisms carry genes that protect them against certain antibiotics. We detect these genes in your sample and assign them to the corresponding drug classes.
The substances below are examples from the drug classes we cover. They are not the full list: your report shows every resistance gene found in your sample, across a much wider range of antibiotics.
Amoxicillin
Widely used first-line antibiotic for ear, throat, respiratory and urinary tract infections.
Ciprofloxacin
Used for urinary tract infections, some gastrointestinal infections and traveller's diarrhoea.
Ceftriaxone
Strong hospital antibiotic for severe pneumonia and complicated abdominal infections.
Meropenem
Reserve antibiotic for life-threatening infections. Resistance is a globally observed issue.
Vancomycin
Used against resistant gram-positive bacteria and for infections with Clostridioides difficile.
Azithromycin
Frequently prescribed for respiratory infections and certain sexually transmitted infections.
Tetracycline
Used for skin conditions, acne and some intestinal infections.
Trimethoprim and sulfamethoxazole
Frequently prescribed for urinary tract and gastrointestinal infections.
When this information can be helpful
When several courses of antibiotics in a row have achieved little.
With recurrent urinary tract or intestinal infections.
Before a planned operation or immunosuppressive therapy.
After a hospital stay or long-distance travel.
If you care for relatives with a weakened immune system.
Resistance genes are part of our standard report. It shows drug class, gene and status so that you can discuss the result with your doctor.
Included in your test kit
Everything you need to collect your sample
The kit arrives as a box with everything you need to collect your sample at home. Afterwards, the tube goes back into the same box and you send it to the laboratory using the prepaid return label. Nothing to buy, nothing to pack and no appointment needed.
bactera.Microbiome 360°
Photo: box with kit contents
What is in the box
1
Collection tube with stabilising solutionKeeps the DNA in your sample stable in the post, without refrigeration.
2
Collection aid (Stool Catcher)Placed over the toilet so that collection stays clean and simple.
3
Illustrated step-by-step instructionsFour steps on one sheet, plus the notes on preparation.
4
Card with your registration code (Sample ID Card)Use it to link the kit online with your Bactera account.
5
Hygiene bag (protective bubble wrap)Sealable and padded, for safe transport of the tube.
6
Prepaid return label on the boxThe same box goes back to the laboratory. Seal it, apply the label, drop it off. Return shipping is included in the price.
The method
Why shotgun shows more than a 16S test
Most gut microbiome tests read a single marker gene or culture only what will grow in the lab. We read the entire DNA of your sample.
Sequencing in Germany
Culture methodCulture(other providers)
16S sequencing16S(other providers)
Shotgun metagenomicsShotgun(Bactera)
What is read
Some bacteria and fungi
A single marker gene
The entire DNA of the sample
Resolution
A few bacteria
Mostly genus level
Thousands of species
Viruses
No
No
✓Yes
Fungi
Partly
No
✓Yes
Parasites
No
No
✓Yes, including Giardia, Cryptosporidium and Entamoeba
Functional genes
No
No
✓Yes, genes for butyrate, nitrate, mucin and more
Antimicrobial resistance
Limited
No
✓Yes, hundreds of resistance genes screened
Sequencing depth per sample
Bactera shotgun metagenomics10 millionPaired-end reads per sample. The DNA of all organisms in the sample is read. Deeper sequencing with 25 million reads is available on request.
around 1000 times
Typical 16S testapprox. 10,000Reads per sample, limited to a single marker gene, usually with resolution down to genus level.
Shotgun (Bactera)10 million
16S testapprox. 10,000
Bars on a logarithmic scale
The comparison covers only the sequencing depth per sample, i.e. the number of reads analysed. It refers to the analysis method and not to individual providers. More sequencing depth means more DNA analysed per sample.
On request
Beyond the standard report: options for research and specialist questions
The Microbiome 360° Gut report is already complete. For research groups, clinicians and anyone with a specific question, we offer three extensions. You can request them on top of the standard order, and each is quoted individually. Write to us before you order, because the extensions have to be arranged before your sample is sequenced.
Sequencing depth
Deeper sequencing: 25 million paired-end reads
Our standard depth of 10 million paired-end reads is more than sufficient for the full report. On request we sequence your sample at 25 million reads, 2.5 times the data. This is worth considering when the question is about organisms that make up a tiny fraction of the community: more sensitive detection of rare pathogens, parasites and yeasts, more resistance genes recovered at low abundance, and more robust functional-gene profiles. It changes how much we see at the margins, not the report itself.
Same kit, same sample, same report structure
Must be arranged before the sample is sequenced
Longer turnaround, quoted individually
Research use only
Virulence gene analysis
Whether a bacterium can cause disease often depends less on the species than on the toxin and adhesion genes it carries. On request we screen the sequencing data for the virulence-associated genes of the most important intestinal pathogens:
Clostridioides difficile: toxin A and B (tcdA, tcdB) and binary toxin (cdtA, cdtB)
Detection of a virulence gene by shotgun sequencing shows that the genetic marker is present in the community. It does not establish a specific pathogenic strain, active expression of the gene or a clinically active infection, and assignment to a particular organism depends on sequencing coverage. Can be run on existing data.
Research use only
Phage analysis
Bacteriophages are viruses that infect bacteria, and they are by far the most numerous viruses in the gut. Because they shape which bacteria thrive, the phage community is an increasingly studied layer of the microbiome: shifts in phage diversity and in the balance between phages and their bacterial hosts have been described in inflammatory bowel disease, after antibiotics and in metabolic conditions. On request we profile the phages in your sequencing data and their diversity.
Phage composition and diversity, including crAss-like phages
Taxonomic table of the detected phages with their relative abundance
Interested in one of these options?Send us a short description of your question and we will reply with a quote. For deeper sequencing, please contact us before you order the kit.
Among the leading gut microbiome analyses in Europe
Most gut microbiome tests on the German market use 16S sequencing or culture methods. We rely consistently on shotgun metagenomics, the method used in international microbiome research. Here is what that means in numbers.
10 millionPaired-end reads per stool sample
Sequencing depth at the level of international microbiome research, instead of the roughly 10,000 reads of a typical 16S test. Deeper sequencing with 25 million reads is available on request.
1000sMicroorganisms screened per sample
Bacteria, fungi, parasites and viruses from the same sequencing run. In your report, 38 relevant organisms are profiled in seven groups and compared with a healthy reference cohort.
100sAntimicrobial resistance genes screened
Part of our standard report and not an add-on module at extra cost.
01Species level instead of genus level
A 16S test usually stops at the genus. We identify the species, and species of the same genus differ considerably in their metabolism.
02Technologically in the leading group
Shotgun metagenomics at species level is the standard that international microbiome research is guided by. In consumer analytics it is one of the few methods used worldwide.
03Analysis in our own pipelines
The bioinformatics runs in our own analysis pipelines in Cologne, at the highest scientific standard. We do not buy in ready-made reports.
04Resistome as a fixed component
Hundreds of antimicrobial resistance genes, assigned to their drug classes, are part of every report. In the German-speaking consumer market this is still the exception.
05Your raw data stays yours
Full organism list, FASTQ files and raw abundances downloadable at any time, and your report is upgraded free of charge as new analyses become available.
06No supplements afterwards
We do not sell you products based on your own results. The report is the product, not the entry into a sales funnel.
This assessment refers to the analysis method used in each case and to publicly available information from providers of gut flora analyses for consumers in the German-speaking region, as of 2026.
Reviews
What our customers say
All reviews are collected through Reviews.io and come exclusively from verified purchases.
Frequently asked questions
Frequently asked questions about the gut analysis
What is a gut microbiome test and what does it show?
A gut microbiome test examines the microorganisms in your gut from a stool sample. Our test uses shotgun DNA sequencing to read the entire DNA of the sample and identifies bacteria, viruses, fungi and parasites down to species level. The report shows species richness, composition, dysbiosis measures, enterotype, functional potential, risk assessments for 15 conditions and a screening for clinically relevant organisms.
What does dysbiosis of the gut flora mean?
Dysbiosis describes an imbalance in the microbial community, for example when protective organisms recede and pressure-associated ones increase. In the report we summarise this through diversity, core organisms, the resilience index and pathobiont pressure.
Why is species richness important?
A species-rich ecosystem has more functional redundancy: several organisms can take on the same task, such as producing butyrate. That makes the community more robust against disruptions. This is why we always read it together with composition and function.
What does the risk assessment show?
From your microbiome signature, the report calculates a protection or risk value for 15 conditions, including inflammatory bowel disease, colorectal cancer, type 2 diabetes and irritable bowel syndrome. It is a microbiome-based assessment and not a medical diagnosis. Each assessment shows the contributing bacterial strains and a one-sentence interpretation, so you can take it straight into your next consultation.
What is the difference between shotgun sequencing and 16S rRNA?
A 16S test reads a single marker gene, a kind of genetic barcode, and usually gets as far as genus level. Shotgun metagenomics reads the entire DNA of the sample. This gives identification at species level, detection of viruses, fungi and parasites in the same run, and the analysis of functional genes and antibiotic resistance genes. Most lower-priced gut microbiome tests on the German market work with 16S.
Who should take a gut microbiome test?
Adults aged 18 and over who want a detailed picture of their gut flora, want to base their diet on data or want to understand where their gut stands after antibiotic therapy. With persistent complaints, blood in the stool or unintended weight loss, medical evaluation comes first. For children and teenagers, there is a kit version based on their age.
How long does the analysis take?
Usually 4 to 6 weeks after your sample arrives at the laboratory. The reason is the method: shotgun metagenomics generates considerably more data than a 16S test, and this data is then analysed in our own pipelines. You will be notified by email as soon as your report is ready.
How do I collect the sample and what should I keep in mind?
With the tube from the test kit, at home, in a few minutes. Eat as usual in the days before and do not change your diet specifically for the test. Do not collect a sample during an acute gastrointestinal infection. Ideally stop probiotics seven days beforehand, and after a course of antibiotics wait four weeks if possible.
What does the test cost and does health insurance pay for it?
The test costs a one-time €229 including shipping and prepaid return within Germany. It is a self-pay service. Statutory health insurers in Germany generally do not cover the cost of microbiome analyses. Whether a private insurer or a subsidy scheme contributes depends on your plan.
What do free report upgrades mean?
We continuously add new analyses to the report. When a new analysis becomes available, your existing sequencing data is re-analysed and your report is upgraded at no cost, without you sending in a new sample. Your result therefore grows with the state of science. You can object to the storage of your data at any time.
Your €20 welcome discount is active and will be deducted at checkout.
Choosing a selection results in a full page refresh.